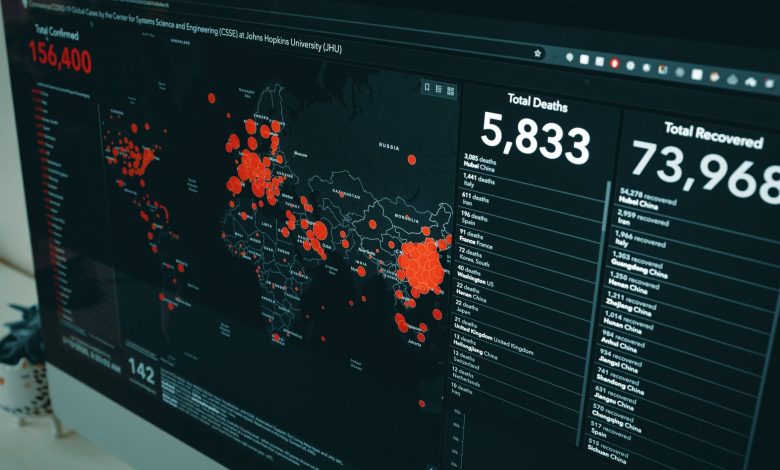
Tableau claims to be one of the leading platforms for analytics. The platform helps people see and understand data. As technology has advanced, many organizations choose platforms that help in the easier and efficient analysis of data. Tableau is the market-leading choice of business intelligence firms which makes exploration and management of data easy. The major aim of the software is to help people see and comprehend data. Whether you are a data analyst, a student, or a teacher, Tableau is designed to be the most powerful, secure, and flexible platform to perform data analytics.
Tableau helps people to analyze data faster and efficiently. It even helps to make a bitesize piece of information into an understandable format. Hence, everyone can grasp data better with the help of Tableau. Tableau was founded in the year 2003 as a result of a computer science project being done at Stanford University. The founders aimed at improving the flow of data analysis and make data more accessible to people with the help of visualization.
Importance of Data Analysis and Visualization
Data analysis helps businesses in making efficient and well-informed decisions. It helps organizations to assess their position in the market in comparison to their competitors. With the analysis of data, a business is able to analyze the trends with respect to customer behavior and market needs. This subsequently helps in increasing the productivity of the business while making effective decisions for the business.
Data analysis is important in business because it helps them to understand the problems faced by the organization. The data can also be explored in a meaningful way.
Since there is a significant amount of information collected through data analysis, there should be a way to paint a picture of the data so it can be interpreted. Data visualization is one of the ways which helps in giving people a clear and comprehensive idea of what the information is with the aid of graphs and charts. In the process of data visualization, the raw dataset is taken and is modeled, and delivered in order to draw out conclusions. Data visualization techniques like histograms, infographics, and area charts help people in understanding the data in a better way.
Tableau Products
There are two sections under which the Tableau data analytics tool falls – ‘Developer Tools’ and ‘Sharing Tools’. Developer tools are used for development and sharing tools are for sharing. The developer tools help you in creating dashboards, charts, and reports. Whereas sharing tools helps in sharing creations.
1. Tableau Desktop
Tableau desktop helps in coding and modifying reports. With the help of the Tableau desktop, you can create graphs, charts, and reports. They can be combined into a dashboard. The two services offered are Tableau Personal and Tableau Professional. Tableau personal will only allow you to work in a private mode whereas the latter will allow your work to be published on the Tableau server.
2. Tableau Public
Tableau public is a budget-friendly tool that is free for the public. People can use it to send workbooks to Tableau’s public cloud. These workbooks can then be accessed and viewed by the public.
3. Tableau Reader
Tableau Desktop and Tableau Public helps you to create workbooks. Whereas Tableau Reader helps you in viewing visualizations and these workbooks. You can modify the data to some extent but you can filter it without any limitation. However, Tableau reader allows everyone to view the workbook which might arise a security concern.
4. Tableau Server
Tableau Server allows users to share data visualizations and workbooks created. The security is high so this should not be the concern of users.
5. Tableau Online
Tableau Online is sharing tool which allows you to publish data and does not have a fixed limit of how much you can store.
How Tableau Works?
You can download Tableau and start your free trial. Tableau will allow users to connect and extract data from different places. Regardless of where the data is stored, Tableau will extract data from anywhere and use it for analysis. It is able to extract data from Excel, Oracle, SQL, Microsoft, PDF, and other platforms. Once you have downloaded Tableau and connected it to a database, you can pull information or even extract real-time data using Tableau’s data engine.
The perks of using Tableau are as follows:
- Tableau is an easy to use platform
- You can perform data collaborations
- The platform allows users to perform real-time analysis
- Tableau also allows data blending
Therefore, Tableau is a platform used for managing metadata, importing data, and translating queries into visualization.


