How Technical Analysis Can Improve Your Trading Results

Are you thinking about using the power of technical analysis to add energy and accuracy to your trading results? If so, you are like thousands of others who make the same decision, and for good reasons. People who gravitate toward technical analysis prefer its objectivity, the fact that it can be used in any kind of market, its reliance on averages, the chance to use back testing, and the ability to practice technical analysis techniques via a demo account. In short, there’s plenty to like about technical analysis, and dozens of reasons to use it in your daily trading activity. This is true whether you buy and sell stocks, forex, commodities, gold, cryptocurrency, or other types of assets. Here are some of the top reasons for the worldwide popularity of technical analysis.
Objectivity
Numerical indicators, which is what technical analysis is based upon, is a mathematically objective strategy. That does not mean it can help you choose the right trading platform or that it has the ability to predict the future. However, technical analysis is a math-based discipline and deals with specific numbers and formulas. Technical analysis is the opposite of fundamental analysis, which is built on qualitative characteristics of companies instead of raw, objective numbers.
Forex Applications
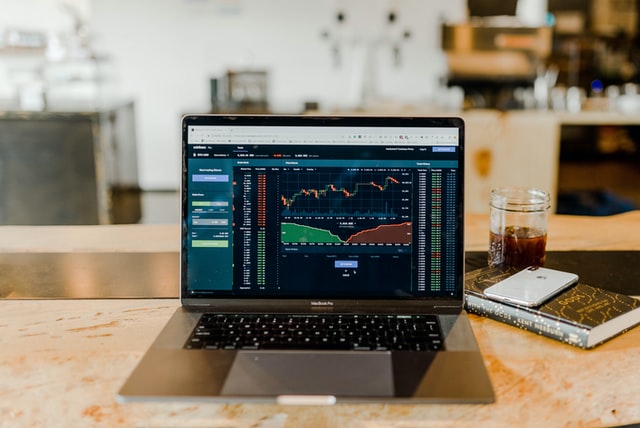
Investors who trade the forex markets use multiple technical analysis techniques to evaluate currency pairs. One of those strategies is based on recent price averages. In fact, most of the top brokerage platforms let account holders employ multiple technical analysis measurements as chart overlays. That way, it’s easy to get a visual of where resistance levels are, where support is, how the two currencies have fluctuated in relative price in the recent past, what the 200-day and 50-day averages are, and more. In addition to moving averages, forex enthusiasts often make use of Bollinger bands, ATR (average true range), RSI (relative strength index), the MACD (moving average convergence divergence, and several other indicators.
Averages Tell a Story
Active traders in nearly every asset class compare long-term and short-term price averages and make educated guesses about future prices. This can help them get prepared for wild swings in either direction. The most classic example is when an asset’s 50-day moving average price line rises above its 200-day average line, many traders interpret that move as a bullish one. In other words, when 50 breaks above 200, there’s a good chance that prices are entering an uptrend. At least that’s the theory.
Back Testing
One of the main advantages of using numerical-based analysis is that you can back test your strategies and theories and see how well they would have performed in prior time periods. If you come up with the following hypothesis, every time gold’s price breaks through a support level, it will drop five percent in price within two days, you can test the theory on old price charts and see how well it would have performed had you put the theory in place. Backtesting is a good way to check out the overall viability of a technique or hypothesis, but it is not foolproof. Just because something worked for three months last year, for example, does not mean it will perform as well in the immediate or distant future.


